strategic DESIGN + data analysis
Designing Smarter Policies with Data: A Gambling & Mental Health Case Study

Why This Matters
When designing policies for urban health, we need more than just good intentions—we need hard data to guide our decisions. This case study explores how analyzing the relationship between counseling and gambling behavior can lead to better strategies for public health interventions.
In this case study, I explored the relationship between gambling and mental health in NSW to uncover patterns that could inform better public policies. The goal? To bridge the gap between data and action, ensuring that policies are based on real evidence, not just assumptions.
Timeline
1 week
What’s Going On?
Gambling is a significant public health issue, often linked to financial hardship and mental health challenges. This study investigates the spatial distribution of gambling machines and mental health services (counseling centers) in Greater Sydney to explore whether access to mental health services correlates with lower gambling machine availability.
To make sense of the problem, I worked with datasets on gambling behaviors, mental health reports, and socioeconomic factors in NSW. Here’s where data analysis became crucial: trends aren’t always obvious, and raw numbers don’t speak for themselves.
Key questions I aimed to answer
Understand how the availability of mental health services correlates with the concentration of gaming machines across different regions.
Indicators
Gambling Machine (Clubs) Density v.s Mental Health Service Density
Mental Health Service Accessibility
Service Adequacy Ratio
I conducted a Zipf analysis to study how gambling machines and counseling services are distributed across Local Government Areas (LGAs) in Greater Sydney. Zipf’s Law helps us understand size distribution—in this case, how gambling machines and counseling services are ranked relative to population size.
The goal? Identify disparities and provide insights for better urban planning and policy development.
Data Source
Gambling machine distribution across Sydney LGAs
Number of available counselors per LGA
Population data (age 20+) per LGA
Zipf Analysis
For frequency distribution, identifying disparities, etc. more direct approach to examining the spatial distribution of gambling machines and counseling services
📌 Key Takeaway
Gambling machines are more concentrated in specific areas, while counseling services are distributed more proportionally.
This imbalance can create higher gambling exposure in vulnerable communities without adequate mental health support.
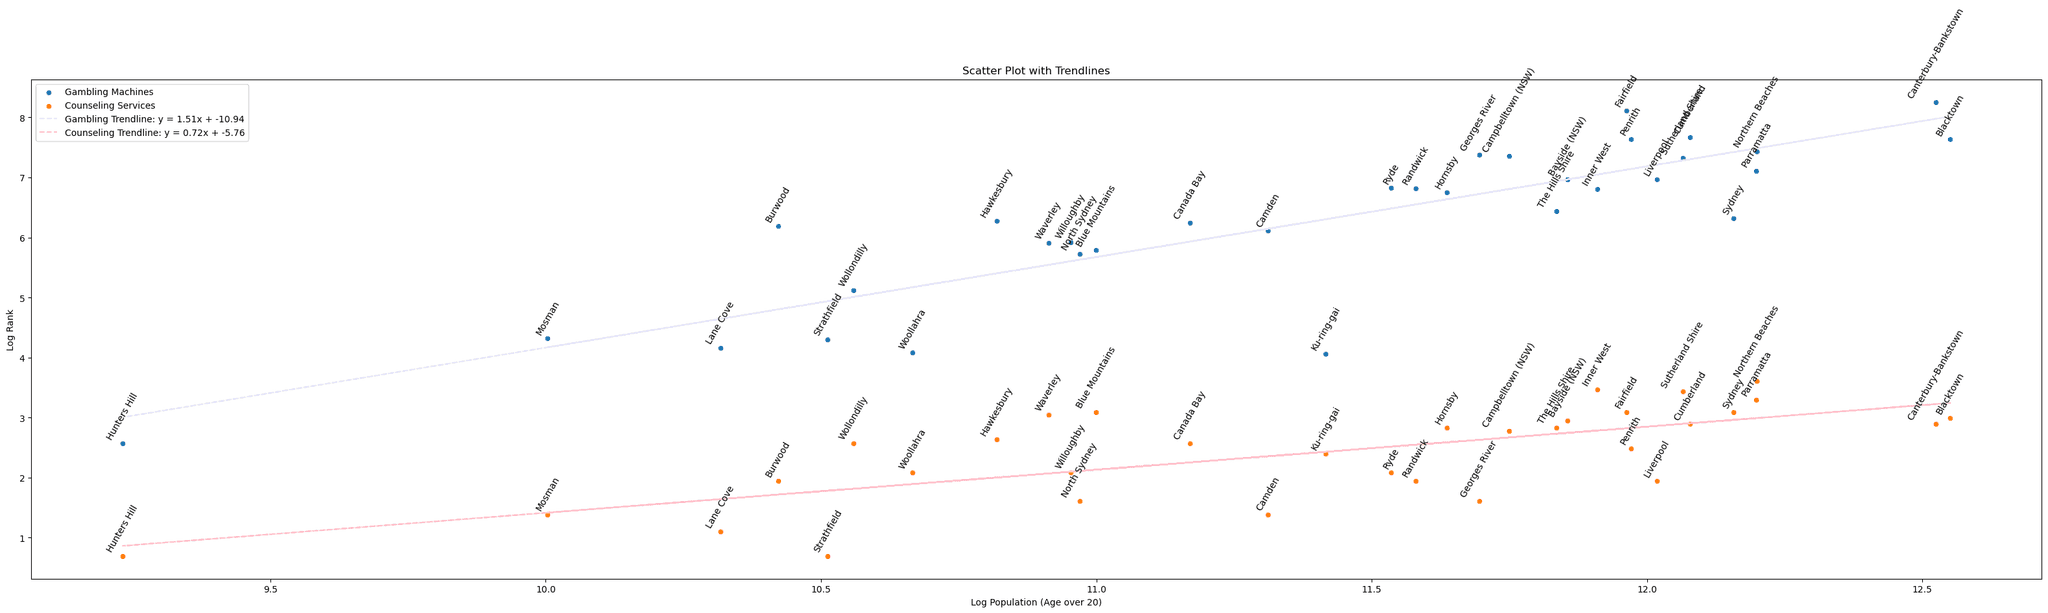
I merged the datasets and applied log-log transformations to compare population size against the number of gambling machines and counseling services. This method, similar to Zipf’s Law, allows us to see if resources are distributed fairly or disproportionately concentrated.
Using Seaborn and Matplotlib, I plotted:
Gambling machine density vs. population (log-log scale)
Counseling service density vs. population (log-log scale)
Trendlines to visualize disparities
🔬 Findings: Gambling Machines vs. Counseling Services
1️⃣ Gambling Machines Are Disproportionately Clustered
The trendline equation:
y = 1.51x - 10.94
A coefficient above 1 suggests that gambling machines are more concentrated in certain areas than expected based on population size.
This means some communities are exposed to significantly higher gambling risks than others.
2️⃣ Counseling Services Are More Evenly Distributed
The trendline equation:
y = 0.72x - 5.76
A coefficient below 1 suggests that counseling services are more evenly spread across LGAs.
This implies mental health resources are not disproportionately allocated, but some high-risk areas remain underserved.
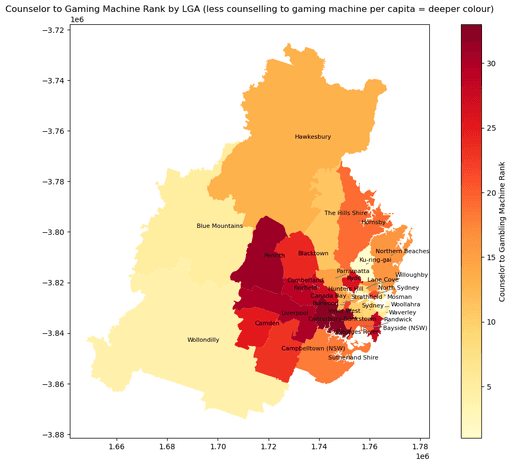
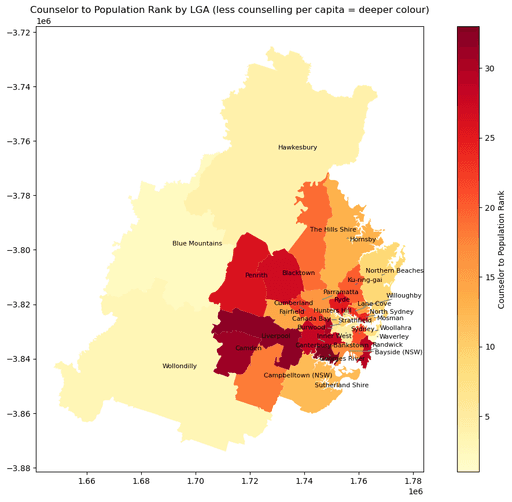
🏆 Ranking Areas in Sydney (LGAs): Who’s Doing Well and Who’s Struggling?
The performance of 33 LGAs (Local Government Areas) in Sydney are compared by three key performance indicators:
1️⃣ Counselor to Gambling Machine Ratio – More counselors per machine = better support.
2️⃣ Counselor to Population Ratio – More counselors per capita = better mental health accessibility.
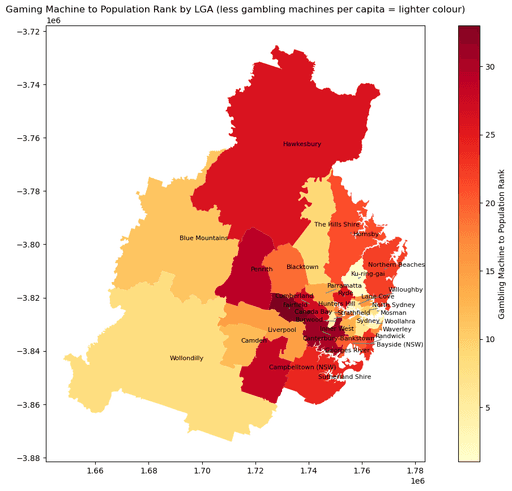
3️⃣ Gambling Machine to Population Ratio – More gambling machines per capita = higher risk
🔎 Inverse Relationship Between Gambling Machines and Mental Health Services
Areas with high counseling service density (e.g., Sydney CBD) have fewer gambling machines.
Regions with more gambling machines tend to have fewer counseling centers, suggesting an uneven distribution of mental health support.
Higher counselor-to-population ratios correlate with lower numbers of gambling machines, suggesting that increased access to mental health support may reduce gambling prevalence.
🏅 Best-Performing Areas
🥇 Ku-ring-gai – The best performer! It has the highest availability of mental health support relative to gambling exposure, with the lowest gambling machine density.
🥈 Hunters Hill – Strong counselor presence per gambling machine and per capita, with relatively low gambling exposure.
🥉 Woollahra – A good balance of counseling support and fewer gambling machines per capita.
😓 Worst-Performing Areas
😩 Fairfield – The highest gambling machine density in Sydney but one of the lowest counseling support levels.
🙁 Georges River – Ranked last in counseling access, meaning people here have the least support to deal with gambling harm.
😔 Canterbury-Bankstown – One of the worst counselor-to-gambling machine ratios, meaning people are much more likely to encounter a gambling machine than a mental health professional.
Data Suggests that Regions with more gambling machines tend to have fewer counseling centers. (more mental health support = less gambling)
Areas with high counseling service density (e.g., Sydney CBD) have fewer gambling machines. (less mental health support = more gambling)
However, there are exceptions…
❗ Areas where gambling machines are high, but counseling is low
Fairfield, Campbelltown, Canterbury-Bankstown – These LGAs have high gambling exposure but minimal mental health services.
❗ Areas where counseling is high, but gambling is also high
Hawkesbury & Sutherland Shire – Despite having more counselors, they still have a relatively high number of gambling machines.
📌 Unexpected Trend Explained
LGAs with unexpected patterns are investigated individually, such as:
Hawkesbury has a historical horse racing culture dating back to 1829. This could be driving gambling demand despite counseling availability.
Sutherland Shire has higher median incomes, meaning people have more disposable income for gambling activities.
🤔 Causation vs. Correlation
While the correlation is strong, the underlying causes remain complex:
Regulatory Policies: LGAs with more mental health services may have stricter gambling regulations, reducing machine density.
Socioeconomic Factors: Lower-income areas may have more gambling machines and fewer mental health resources due to funding disparities.
Young males under 35 with higher incomes and education levels are more likely to gamble online
LGAs with high non-English-speaking populations report higher gambling-related harm
Public Health Impact: Increased access to mental health services may help reduce problem gambling, leading to fewer machines being used.
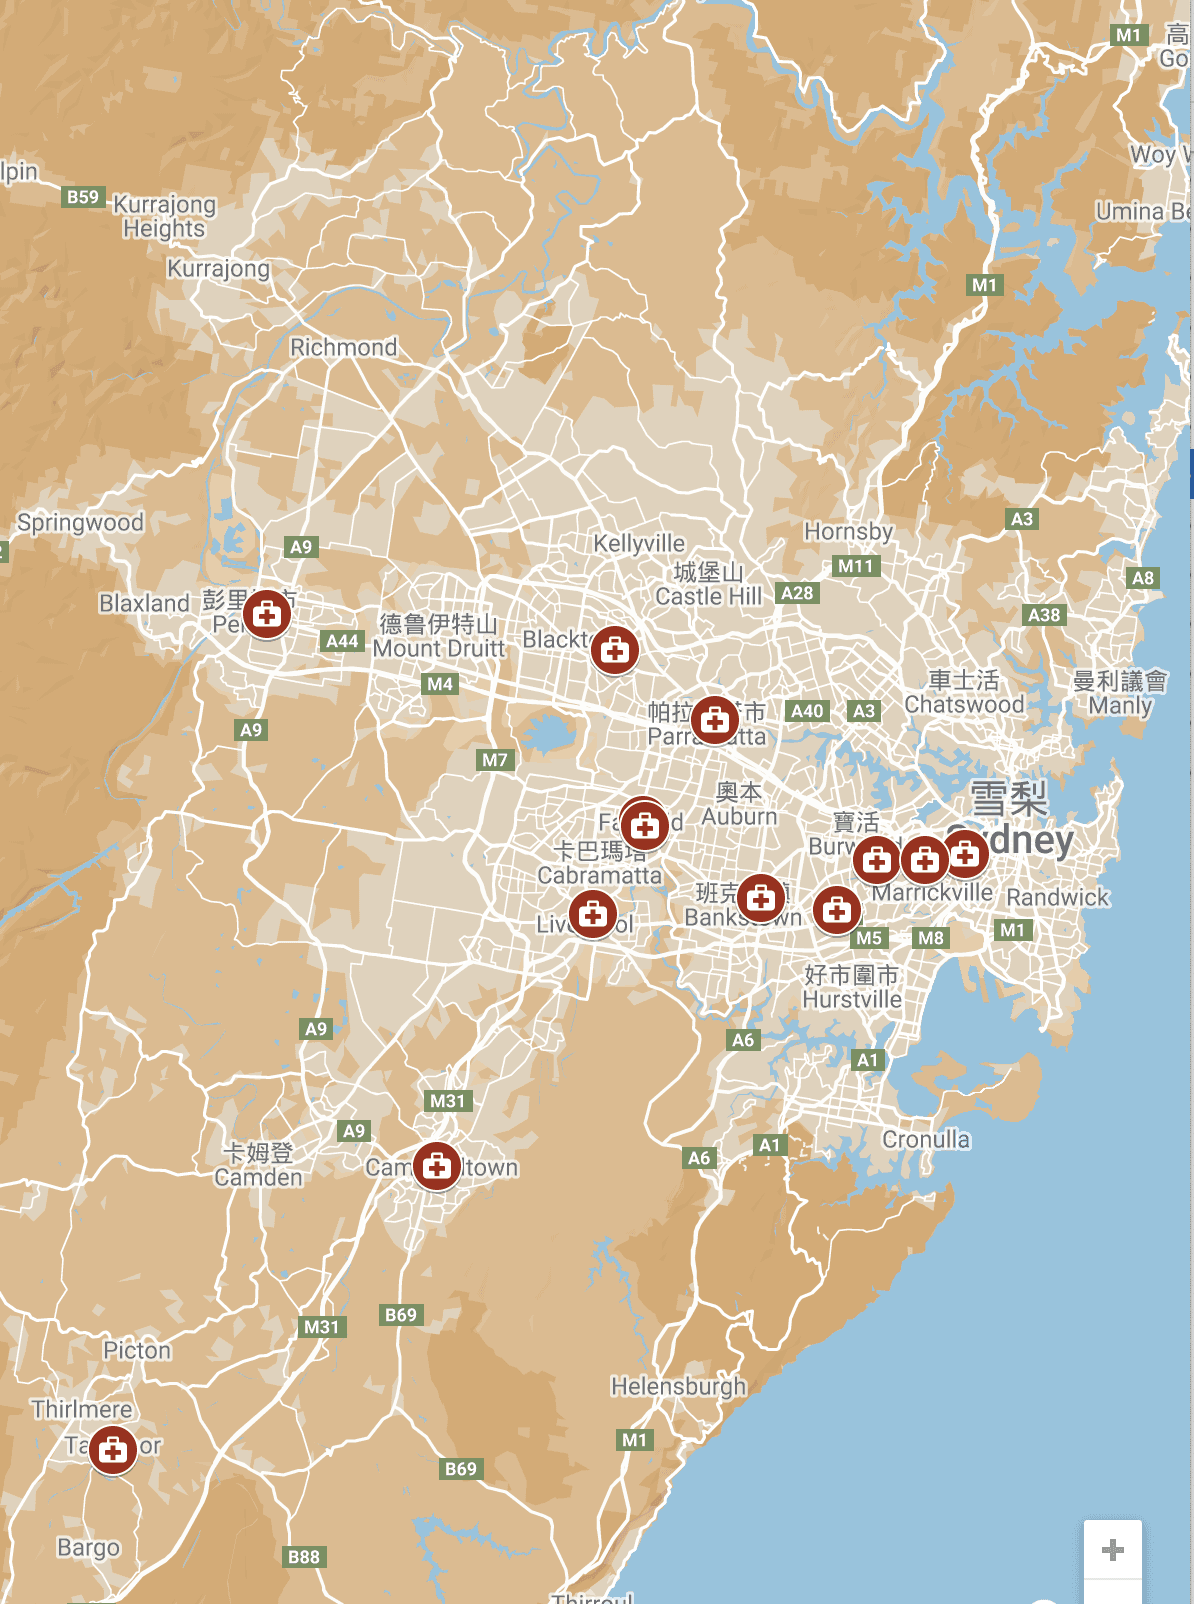
🧐 How accessible are GambleAware Clinics in Sydney?
Having counseling services is one thing—but are they conveniently located for people to use?
I analyzed GambleAware Clinics, which provide free counseling for gambling harm.
✅ Most clinics are within a 10-minute walk from a train station, making them accessible.
❌ BUT some high-risk areas lack clinics!
Hornsby, Hawkesbury, and Northern Beaches have many gambling machines but no clinics nearby.
📌 Key Takeaway
While clinic locations are strategic, some at-risk communities remain underserved.
⚖️ Designing Policies
Counseling Service Gaps
More counseling centers should be established in high-risk areas (e.g., Liverpool, Blacktown, and Fairfield).
Online counseling services should be expanded to meet the growing demand for remote mental health support.
Face-to-face counseling remains crucial, particularly for LGAs with fewer counselors but a growing need for intervention.
Targeted Support for Vulnerable Groups
Young adults (18-24) and non-English speakers are at higher risk of gambling harm.
LGAs like Fairfield and Liverpool need more multilingual counseling services.
Alternative Recreational Facilities
Areas with a high concentration of gambling machines may benefit from investment in alternative entertainment options. (LGA Camden is a good example this works)
Expanding sports and community centers can provide healthier alternatives to gambling.
GambleAware Clinics Expansion
More clinics should be placed in high-population areas with few counselors.
Confidential and multilingual online support should be prioritized.
This project shows how data analysis helps shape better policies by identifying hidden disparities in resource allocation.
Using these insights, policymakers can refine strategies to reduce gambling-related harm, ensuring equitable access to support services, and be precise in resources allocation.
For policymakers
These insights can guide funding decisions to make mental health support more accessible.
For designers
It’s a reminder that data informs strategy, whether you're working in public health, urban planning, or UX research.